NOTE: This project is purely to apply concepts that I have learned from courses and certifications completed and not a formal, independent analyst opinion of any kind.
Find the model here. Any feedback is welcome.
Overview
A three statement model projection into a discounted cash flow model. New improvements to the “template” I have iterated and evolved into using. In this one I’ve incorporated more of a standard structure, along with a proper WACC calculation (rather than assuming a random number), both perpetual growth and multiple method calculations, along with improvements to the sensitivity tables and graphs. Noted that I have only used 30 June annual reports despite the 31 December half year accounts being released – I will build calendarisation into the next iteration of the model.
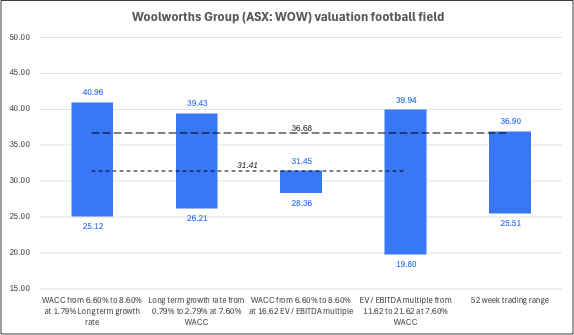
Big dotted line = current price, small dotted line = common value across all valuation methods.
Inputs
Assumptions and drivers
- IBISWorld G4111 Supermarkets and Grocery Stores in Australia – Industry Data Revenue Annual Change projected growth rates for future periods was used to project revenue growth. Noted that this is for the industry and not specific to Woolworths – simply utilising and incorporating external sources for this iteration.
- Historical proportions of other profit and loss line items compared to revenue – gross margin, other income, branch expenses, administration expenses – given highly consistent proportions based on recent financial statements.
- Working capital projected based on either the average turnover days (receivables, inventory, payables) or the latest in a consistent trend (i.e., if increasing steadily period on period, latest was taken).
- Property, plant and equipment, intangibles, lease assets and liabilities – projected based on historic proportions of additions, depreciation, terminations, etc to the average of the current and prior period opening balances. Intention was simply to have “business as usual” movements period on period based on historic financial statements.
- Borrowings projected in same fashion as above with same intention.
- Interest expense calculated on borrowings using a rate derived from the historic proportion of interest expense on interest bearing liabilities compared to borrowings amount. This was used in lieu of explicit rates being mentioned in the financial report.
Weighted average cost of capital
- Market capitalisation taken as of valuation date (30 March 2026) per Yahoo Finance.
- Risk free rate being 10 year government bond yields as per Trading Economics.
- Beta taken as per StockAnalysis.com. Noted no leveraging, and also no calculation of industry beta, deleveraging, releveraging, Blume adjusting, etc. Will build into a later iteration.
- Market risk premium taken as the return on the BetaShares ASX 200 ETF from inception. Probably not the most accurate or technically correct, some bias given date of inception, etc. Intention is simply the mechanics and exercise itself.
- Book value of debt taken from the latest annual report, 30 June 2025, given those are what I’m using in this model.
- Cost of debt is the above noted interest rate based on proportion of expense to borrowings. Not confident in its accuracy given the interest rate is on interest bearing liabilities and the balance was only borrowings (I don’t believe it included lease liabilities). Mechanics and the exercise itself being the goal rather than being technically correct.
- WACC derived is 7.60%.
Terminal values
- Perpetual growth method
- The growth rate used was the average growth rate that the projected unlevered free cash flows arrived at period on period – roughly 1.79%. This is pretty much the average IBISWorld growth rates. Given it is almost the standard 2 – 3% GDP growth rate assumption I left it as is and used it.
- Multiple method
- The multiple used is simply Coles Group’s multiple as of preparation of the model based on the 31 December 2025 half year report (market capitalisation as per Yahoo Finance on the day, I think that one was 29 March 2026). Noted it is only one comparable, would be wiser to use more. Mechanics, building it into the model, and the exercise itself being the goal rather than being technically correct.
- The multiple derived was 16.62.
Analysis
- Model outputs
- The model arrives at $31.80 per the perpetual growth method and $29.89 per the multiples method.
- Sensitizing inputs arrives at ranges spanning from $19.80 to $40.96.
- Average midpoint arrives at $31.41 (average midpoint of all ranges, price that is common to every valuation method used).
- Closing price as of valuation date (30 March 2026) was $36.68, with 52 week trading range being $25.51 to $36.90.
- The model outputs are quite low compared to the current trading price. The current price has risen from ~$31 to ~$36 in late February.
- Upon investigation this is due to the release of the half year financial report which showed higher than expected growth. This growth is much higher than the IBISWorld projected industry growth which I used in the model.
- Further, my model uses the year end 30 June 2025 as a base rather than this better performing half year ending 31 December 2025. If I were to use last twelve months’ adjustment in the model it would align the valuation a bit better to what it currently is.
- The ~$30 valuation is pretty in line with what it was just prior to the half year results release… slightly chuffed. : )