Based on data as of end of Jan26 to predict Feb26 decision.
Access the spreadsheet tracker here.
First iteration. I don’t know what this will look like, I am going to get let it evolve over time. I think I’ll try and build out to address all kinds of metrics that the RBA speaks to in its meeting minutes and then summarise the trend for each one as either indicating lower / hold / raise to then show broadly how all the metrics are pointing and what overall the decision could be expected to be. Also may not be technically correct in many ways but will learn as I go.
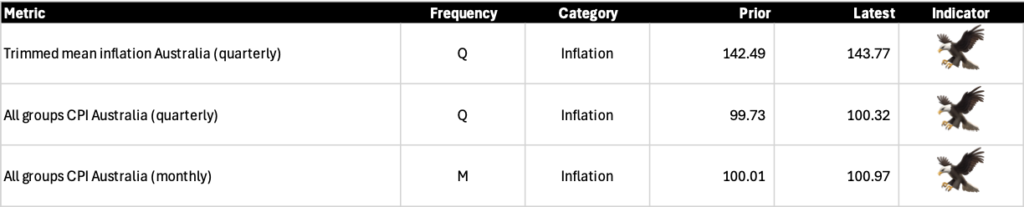
Starting off with inflation to look at and get into a bit. I’ve picked three metrics:
- Index Numbers ; Trimmed Mean ; Australia ; Quarterly (ABS Series ID: A3604503X)
- Index Numbers ; All groups CPI ; Australia ; Quarterly (ABS Series ID: A2325846C)
- Index Numbers ; All groups CPI ; Australia ; Monthly (ABS Series ID: A130393720C)
I know that in the latest meeting minutes inflation was noted as a concern with it being or remaining higher than expected or anticipated. Hence the focus this time around. Based on above three, seeing the following:
- Trimmed mean quarterly: 3.35% for Dec24 – Dec25. Above 2 – 3% target.
- All groups quarterly: 3.63% for Dec24 – Dec25. Above 2 – 3% target.
- All groups monthly: 3.76% for Dec24 – Dec25. Above 2 – 3% target. 0.96% for Dec25 from Nov25, much higher than recent monthly percentage movements (arithmetic average of 0.25% for monthly movements Jan25 – Nov25).
Guessing it will still be a strong consideration point given last meeting it was a concern and potentially looks even worse month on month (but also noting monthly one is not trimmed mean, potentially more volatile and less indicative of underlying). Assuming hold / raise interest rates.